Overview
If the application is seeing performance issues but it isn't attributable to the backend (as diagnosed by other tools such as thread dumps), it's useful to get information from the browser. Namely, the network information, and console logs, to look for any errors in the front end.
This article outlines the process of generating client-side diagnostic information using Chrome.
Process
- Open the Chrome developer toolbar.
- Right-click on any empty space of chrome window.
- Click on Inspect or Inspect Element.
- Go to the Network tab.
- Clear all the existing text in the Network tab if there's any by clicking the clear icon next to the red circle icon at the top left corner of the developer tool window.
- Requests are logged into the network window.
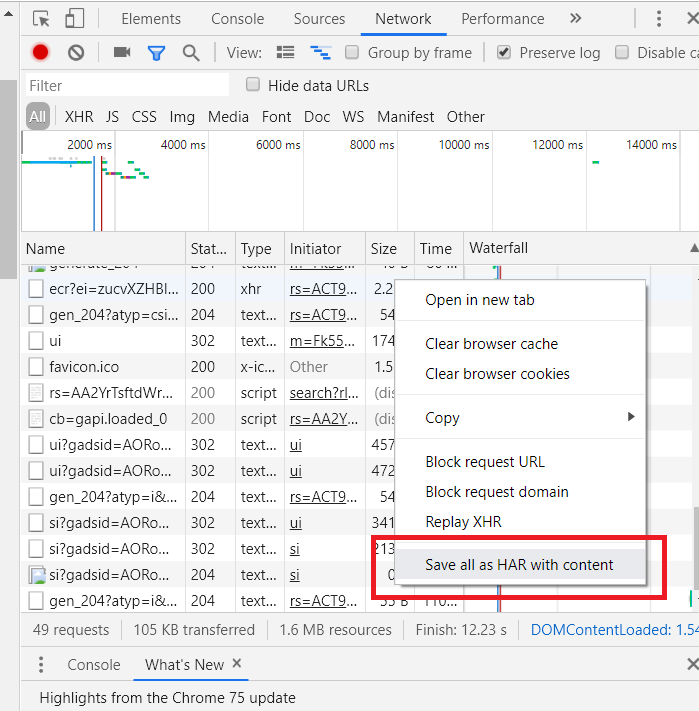
- Save this information to a HAR file by right-clicking within the Network tab and selecting the 'Save as HAR with Content' option.
Other Tools
There are also standalone tools that can be used to get more in-depth client-side diagnostics. These other tools are used in more complicated cases:
- Fiddler
- Charles Proxy
In most cases, the browser tools are enough to gather information as they achieve similar results as the standalone tools, 80% of the time.
Note:
- The standalone tools will act as a man-in-the-middle as they will become the proxy for all HTTP/HTTPS traffic going TO and FROM your client device (usually leveraging an interception certificate). Cached data (that is taken from disk cache) is not recorded by these tools!

Priyanka Bhotika
Comments