Overview
If you are experiencing an issue with the Jive platform then Jive Support may ask you to reproduce the issue once more and then attach the error output from your browser's Developer Console. This output may include additional information that can help inform the support team of what may be causing the problem you are seeing and can aid Jive in troubleshooting your case.
Follow the steps below to find the Developer Console for either Chrome, Firefox, or Internet Explorer.
Process
Chrome
- In Chrome go to the top menu bar and go to View > Developer > JavaScript Console.
Error: Server is not responding (500)
connectToServer
(anonymous function)
InjectedScript._evaluate0n
InjectedScript._evaluateAndWrap
InjectedScript.evaluate

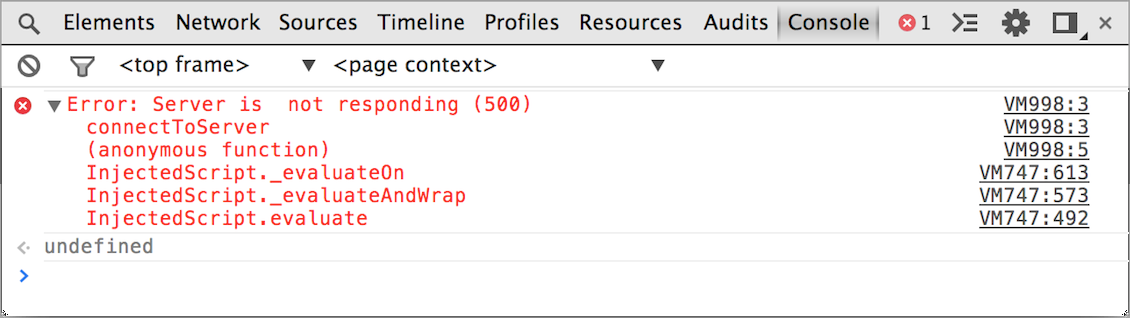
- You may see errors like seen in the above screenshot in the JavaScript Console. Please take a screenshot of this and post it to your case.
Firefox
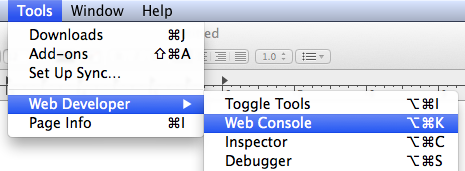
- In Firefox, go to the top menu bar and go to Tools > Web Developer > Web Console.
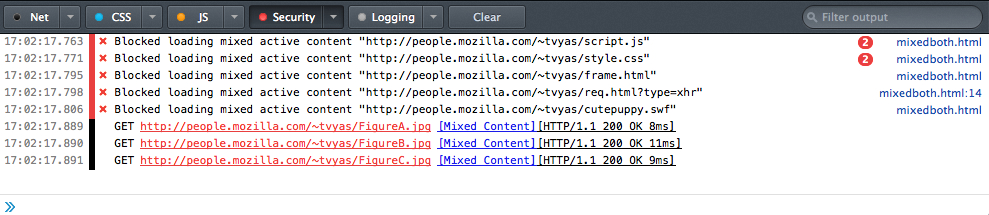
- Please take a screenshot of the output and post it to your case.
Internet Explorer
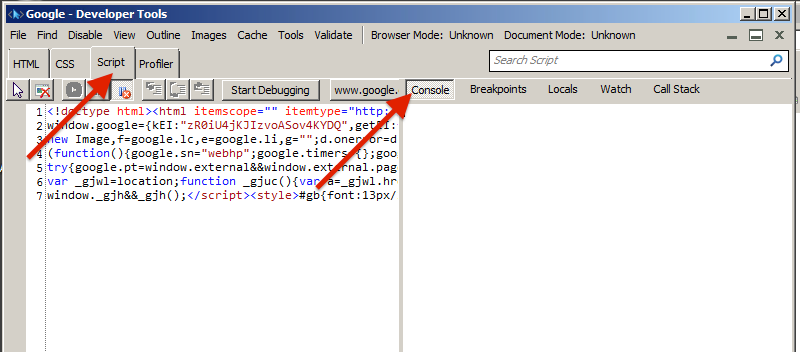
- In Internet Explorer, go to Tools > Developer Tools and in the pop-up window go to the Script tab and then click Console.
- You can also press F12 on your keyboard to quickly open this window.
- Take a screenshot of the output and post it to your case.

Priyanka Bhotika
Comments